by Abhijith DSouza | Feb 27, 2020 | Power BI
You cannot password protect a Power BI report natively. However there are some hacks which you can use which simulates password protection. However these can easily be “unhacked” so please do not use these techniques on client sensitive data. This is more...

by Abhijith DSouza | Feb 25, 2020 | Mining Intelligence, Power BI
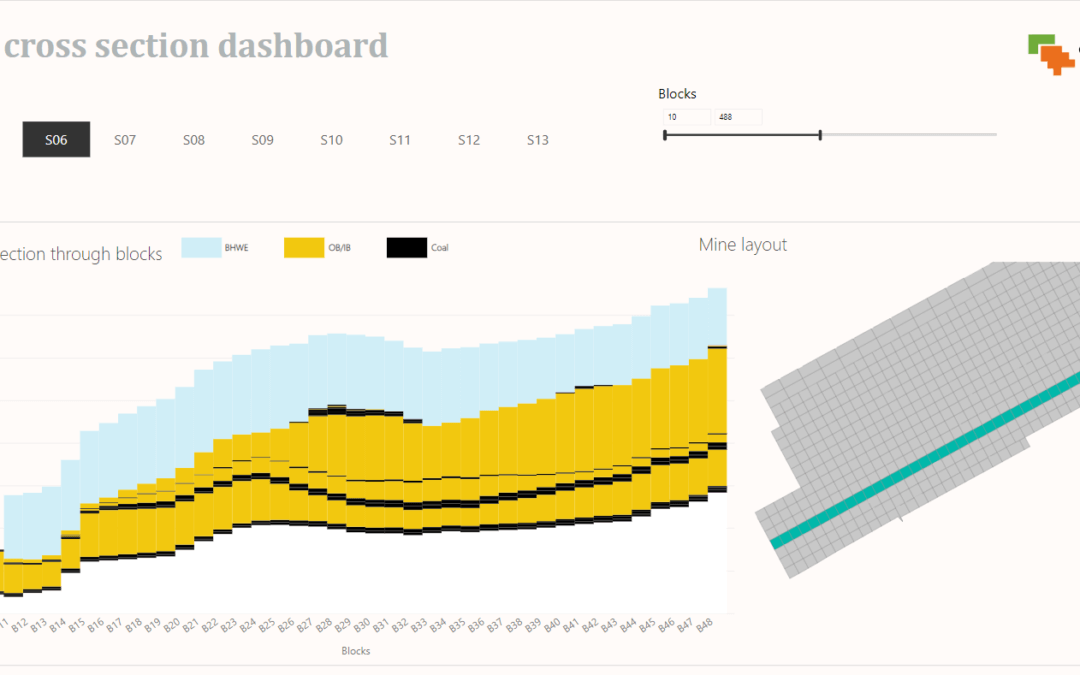
Mining industry is swimming with data. There is data from exploration, geology, mining, processing, shipping and from other areas of the supply chain. Most of this data can only be viewed and analysed within specific software relevant to the domain. Ex: A geological...
by Abhijith DSouza | Jan 21, 2020 | Power BI
“I’ll need some information first, just the basic facts” – Comfortably Numb We hear the terms data and information a lot in our lives. What do they mean? Are they the same? If not what is the difference between them? I break it down in this...
by Abhijith DSouza | Jan 21, 2020 | Power BI
You say the hill’s too steep to climb Chiding! You say you’d like to see me try Climbing! You pick the place and I’ll choose the time And I’ll climb The hill in my own way ~ Fearless/Pink Floyd When I started learning Power BI in 2016 it...
by Abhijith DSouza | Jan 21, 2020 | Power BI
The inspiration for this article comes from the app Webull which is a stock market app for investors which includes real time quotes, financial news, investing advice etc. It is one of the best apps in the market if you are a frequent investor in the stock market. It...
by Abhijith DSouza | Jan 21, 2020 | Power BI
The statistical control chart is a graph used to analyse changes of a process over time. The variable to be analysed is plotted against the y-axis and time is plotted against the x-axis. Some of the features of a control chart is the presence of an average line, and...


