
In Part 1 of this series we introduced the concept of enterprise grade semantic models and in Part 2 we discussed some general learnings from developing and deploying enterprise grade semantic models. In Part 3 we will discuss the technical learnings. You won’t find a treatise on how to do each thing in detail but hopefully there is enough content in here to start thinking about applying some of these learnings in your project.
The learnings are divided into 4 sections: IMPORT, MODEL, REFRESH, SUPPORT. These correspond to roughly the four main tasks of a semantic modeller.
IMPORT
-
-
-
-
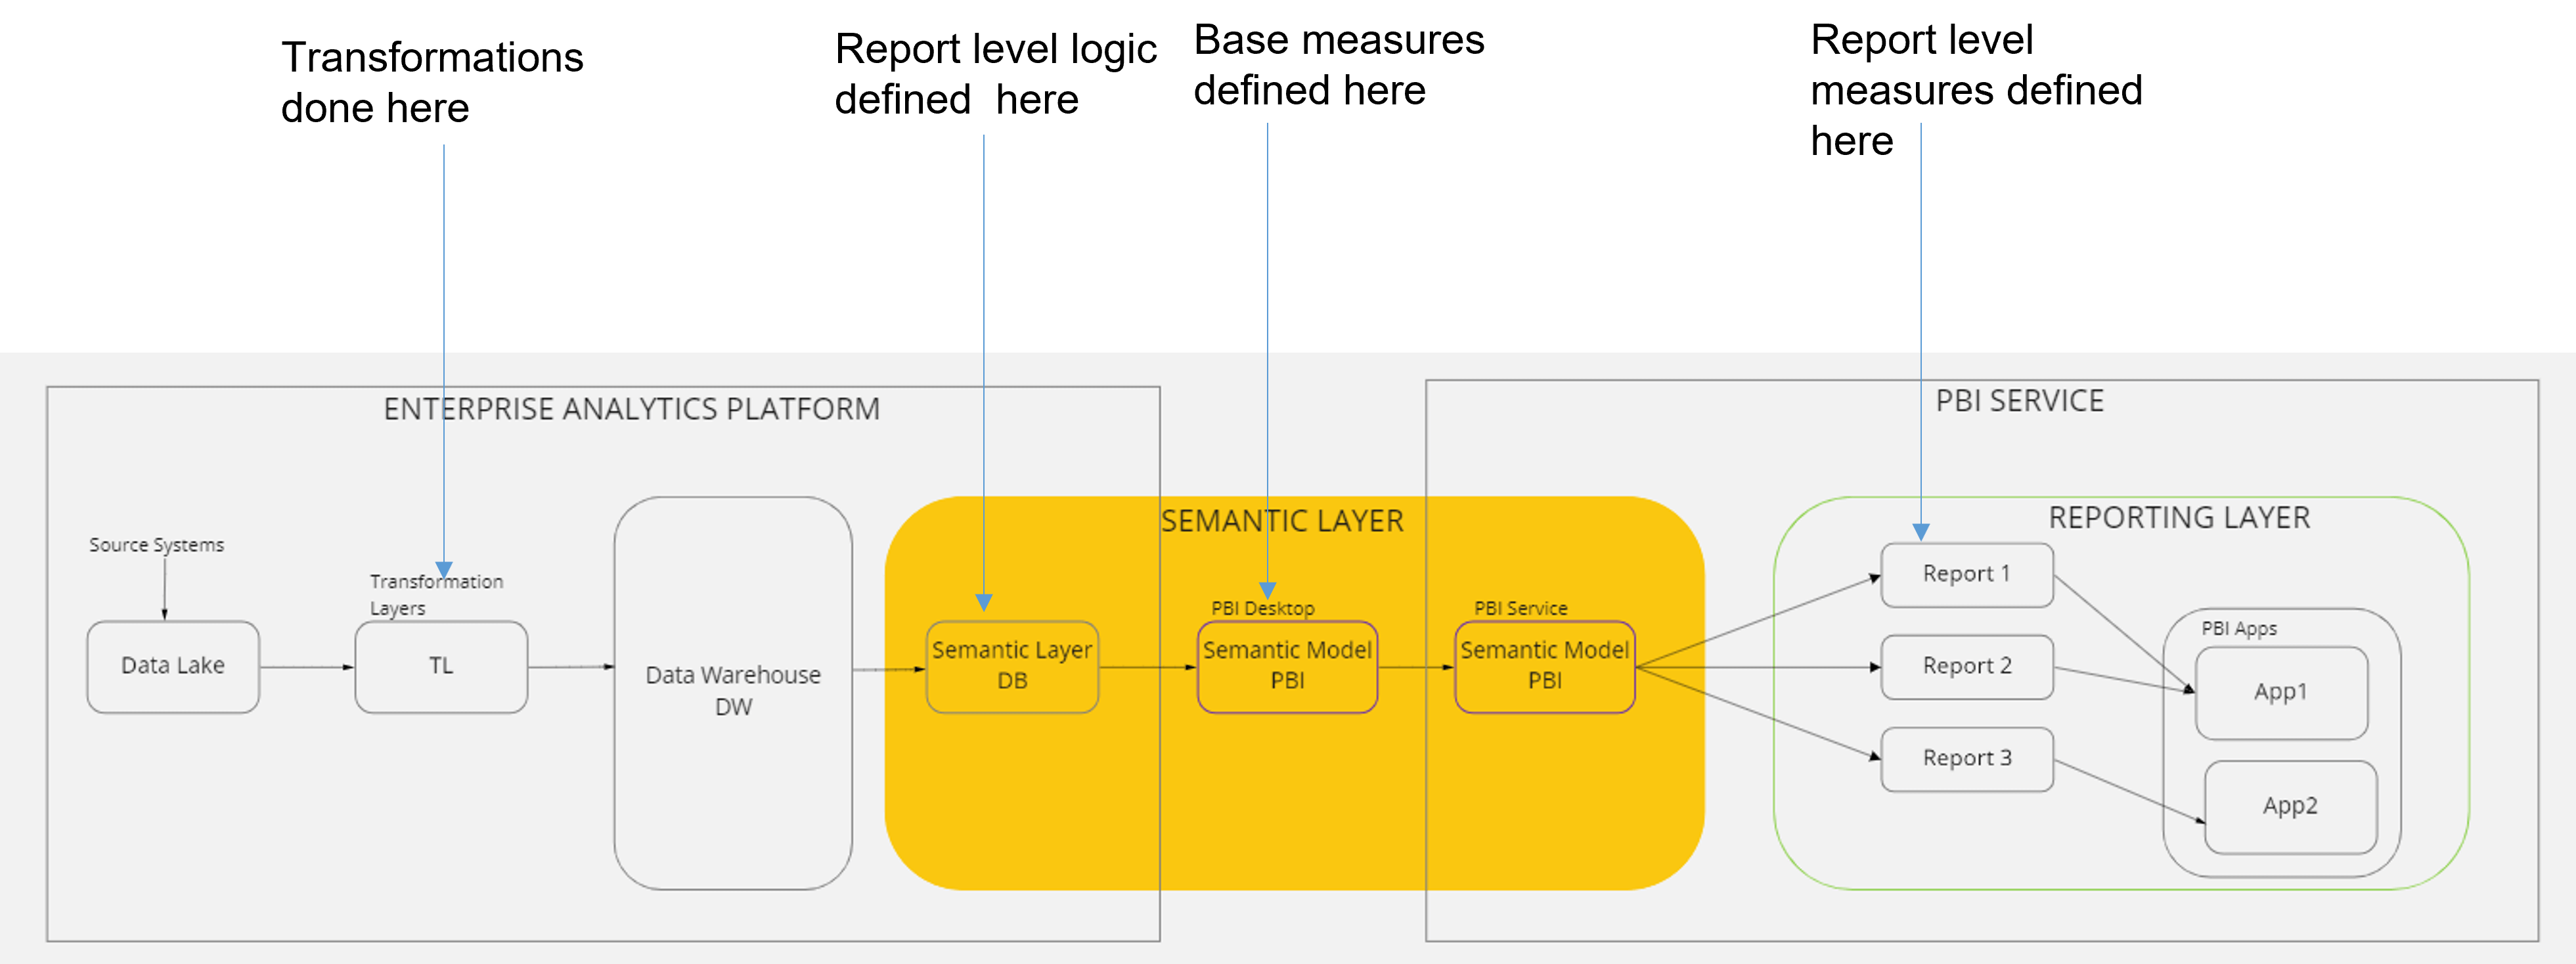
Apply transformations as left as possible
All reusable logic needs to be shifted as left as possible and as close to the source as practical. This is to ensure that the databases do all the heavy lifting (extract, transform and load) and your semantic model becomes a layer to aggregate the metrics via measures rather than an ETL layer. This diagram from Part 1 shows where the various transformations and measures are defined
-
-
-
-
-
-
-
Star schema model is preferred
A star schema is the best technique for faster reports and lesser memory consumption. An enterprise model may have multiple star schemas in the same model, with fact tables linked to conformed dimensions. This is the first step in getting the semantic model right. If it is not star schema, performance will suffer.
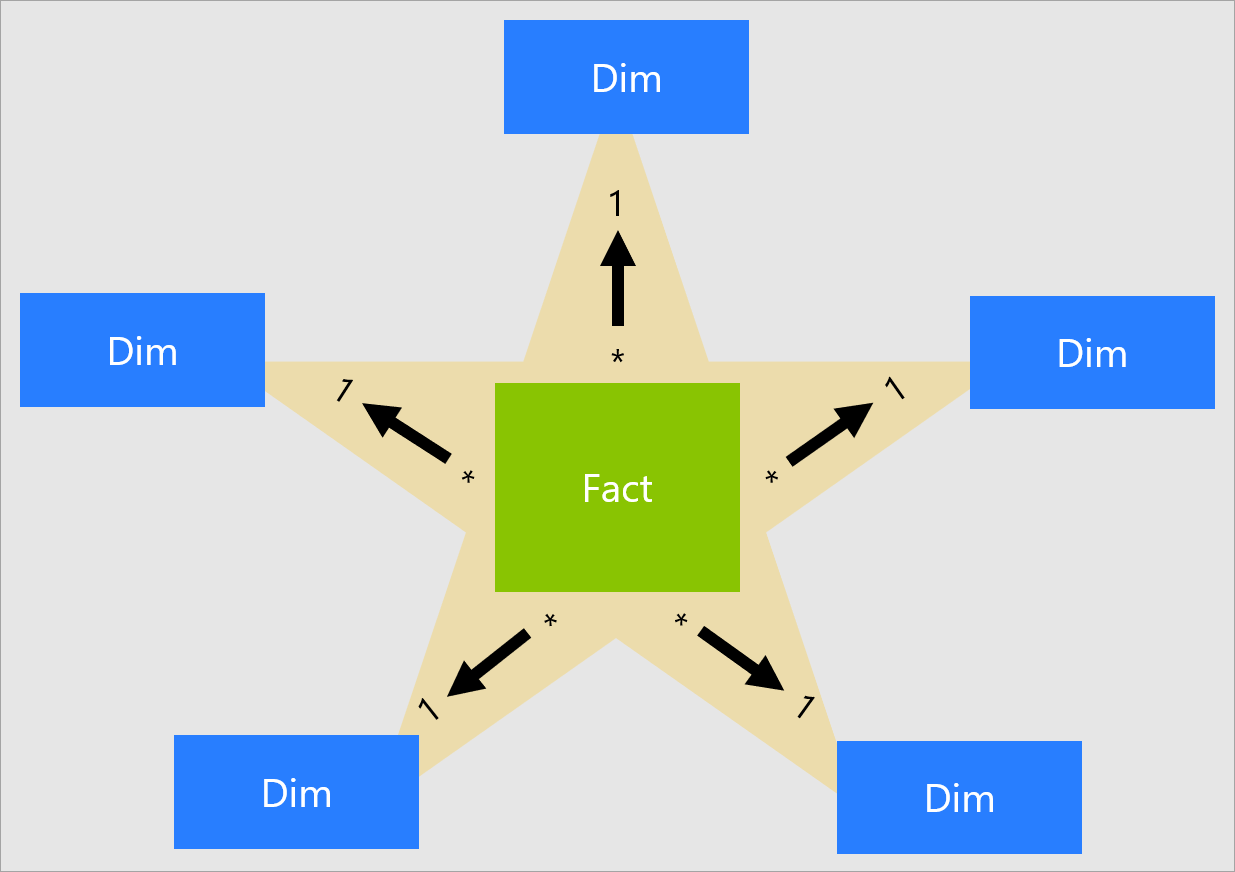
Image source: MS Learn
-
-
-
-
-
-
-
Use views instead of tables
Use views to import data into your Power BI model. Using views has three advantages
1. Tables generally do not contain business friendly names. They might have a name such as MemberAccountBalance_Total which is not user friendly. You can write this in a view as Member Account Balance.
2. You can remove/add columns in views. Tables often contain columns such as Record_From_Date, Record_To_Date etc which are required for testing purposes but are not required in the semantic model. So you can remove such columns in the views. You can also add new columns in the views. These are commonly report level logic which are specific to certain reports. So if you want to bin your data, you can write that logic in the views.
3. You can join multiple tables in views. Sometimes the views are not straight forward and you might want to join multiple tables to form one view to meet the reporting requirements.
-
-
-
-
-
-
-
Simplify views – resulting in simpler DAX
Simplify views as much as possible so that the DAX becomes simpler, and the queries perform faster. The goal of the semantic model is not to show off your DAX, in fact it is the exact opposite. The semantic model should only contain simple aggregations like SUM, DISTINCTCOUNT, AVERAGE and/or simple filters in CALCULATE. If you are traversing multiple tables with DAX then it’s too complex. Move the logic back to the tables/views so that the DAX is simplified.
-
-
-
-
-
-
-
Do not import all data into desktop
This is the key to making your model lighter in desktop and faster to publish. A model I’m currently working on is ~12GB in Power BI service (memory) while it only occupies 4MB of disk space on my laptop. How is it even possible? The trick is to only import a fraction of the data into your desktop model. You can either import only 1000 rows for each table and/or use a ‘Start Date’ parameter to only import from a certain date onwards. Use parameters to achieve this as explained below.
-
-
-
-
-
-
-
Parameterize everything
Use parameters in Power Query. Parameters can be used to store server name, database name, schema name, Start Date. A typical parameter can look like this:
The advantage of using parameters are twofold:
1. You can have different names for servers, databases in different environments. This is crucial as you would publish your model to a UAT/SIT environment first and then push it to production. And normally non prod environments have a different set of servers and databases
2. You can quickly change names of servers, databases, schemas if they are renamed at the source. Without parameters you would have to manually go to each query and change it, which would be time consuming.
-
-
-
-
-
-
-
Utilise query folding in power query
One of the core principles of an enterprise model is that all columns have to be defined in the views and not in Power BI. However, you can certainly remove some columns in Power Query which you may not want to import into your model. An example would be fact table primary keys. These keys are normally created for testing purposes but don’t serve a modelling or reporting purpose. So, you can remove them in Power Query. Another step you might apply in power query is a filtering step to limit the rows being imported. Ensure that these two steps still utilise query folding (from my experience they should)
-
-
-
MODEL
-
-
-
-
Use desktop for DEV
Since you are only bringing in a fraction of the data into the desktop model, it cannot be used to test the data. Use it as a development (DEV) workspace where you apply all column and DAX formatting, table naming, column ordering etc. Since its a lighter model you can easily push the changes to UAT/SIT workspace with the use of external tools (see Use External Tools section).
-
-
-
-
-
-
-
Give descriptions for tables and fields
It’s not just important to import all the data and write good DAX it is also important to provide descriptions to all entities used by the business users in the model (tables, columns, measures, hierarchy) so that they exactly know what those entities are and how they can be used.
-
-
-
-
-
-
-
Follow the eleven rules of DAX management
DAX is the window of the semantic model to the outside world. It is via the DAX measures that users interact with the model. Hence the measures need to be appropriately named, faster to query, and proper formatting applied. Go through this article to apply all the eleven rules of DAX management before pushing the measures to production.
-
-
-
-
-
-
-
Use external tools
The use of external tools greatly increases productivity and agility. There are three main tools which are of importance, and they should be in the arsenal of every semantic modeler. They are all free to use and if you do not have them, get your IT department to install them for you.
Tabular Editor is a tool that lets you easily manipulate and manage measures, calculated columns, display folders, perspectives and translations in Analysis Services Tabular and Power BI Models. You can also automate a lot of the modelling process by writing C# scripts that interacts with the Tabular Model and edits the model. There are a lot of custom C# scripts freely available to get your started. Once you get to know the objects you can manipulate in the Tabular Object Model, you can easily write scripts that performs formatting, column ordering, relationship creation etc. Modelling using Tabular Editor is a breeze and once you start using it you will never go back to using the clunky desktop GUI for your work.
This is the ultimate tool for working with DAX queries. If you are writing lots of DAX, be it in the semantic model or report level measures you can test your queries for speeds, server timings, query plan etc. You can also use the DMV (Dynamic Management Views) to query the TOM model and get important insights like table size, number of rows, measure expressions etc.
This is a great toolkit to manage and publish your datasets to different workspaces. You can compare two datasets and see what is different and push the changes you want to the workspace of your choice. By using this toolkit you are only pushing the metadata changes to a workspace and not the entire dataset. So if you have added 10 new measures into your desktop model, instead of publishing it the manual way using Power BI desktop and updating the model in service and running a refresh on it again, you only update the measures using this toolkit, without a need to refresh the entire model. A must have external tool for agile delivery.
-
-
-
-
-
-
-
Apply incremental refresh where possible
Incremental refresh is a great way to reduce the memory footprint of your models while refreshing. When you apply incremental refresh policy on a fact table in your model you are locking in the past data and only incrementally refreshing the most recent data. Say you have a large fact table in your dataset with 200 million rows and five years’ worth of data and you want to reduce the number of rows to be refreshed every day, you could apply an incremental refresh policy and lock in the first 4 years of data and only refresh the current year. So, every day the fact table only gets data for the current year which would be much less than 200 million which means the model consumes less memory during refresh and you stay well within your memory limit (in case of Power BI Premium subscription).
However, be mindful of the fact that if a table reload is required at the source, then you would need to disable incremental refresh in the model and bring in all the data once again. Be very careful of applying incremental refresh on a table in the model. Only do so when you are 100% sure that no table reloads will occur in the future.
-
-
-
REFRESH
-
-
-
-
Use pipelines in service
Use deployment pipelines in Power BI service to push your models fom UAT to PROD. Deployment pipelines enable semantic modelers to manage the testing and publishing of their semantic models. You can also publish reports, paginated reports, dashboards, as well as dataflows. You can also automate it by using the Power BI Automation Tools Extension in DevOps which is an effcient way of deploying models especially if there are multiple modes.
-
-
-
-
-
-
-
Automate refresh
Automatic refresh of semantic models doesnt mean setting up a refresh schedule for the models. This will not work as if the underlying tables are being reloaded, say each night in the data warehouse the exact time of when the reloads are complete cannot be determined. Hence setting up a scheduled refresh for the semantic models means that the model will start refreshing before the reloads have finished. This results in time out issues apart from not refreshing the latest data.
In order to avoid such a scenario use the Power BI REST API to refresh the models after the reload is complete. Using this APT you can also fine tune the refresh by specifying the Max Parallelism values, tables and partitions to refresh.
-
-
-
-
-
-
-
Monitor refresh
Use the Gen2 Metrics App to monitor the Power BI Gen2 premium capacities. Among the features of this dashboard is the ability to monitor the refresh times, peak memory consumption, CPU usage and number of users utilising your semantic models.
-
-
-
SUPPORT
-
-
-
-
Use source control
Source control is a tricky subject in the Power BI world as there is no built in source control within Power BI. You would need to use a combination of Sharepoint/DevOps to manage your pbix/template files. A good place to start on an automated way to keep track of pbix files is here
A turbulent journey through Power BI source control – Mutt0-ds Notes
-
-
-
-
-
-
-
Document the model
It is important to document the model in production so that everyone from Managers to developers know what entities are available in the model. You can do this manually via Sharepoint/Confluence but it becomes cumbersome to maintain and error prone. An automated data glossary dashboard which extracts the metadata from your models in production is a much better scenario. This glossary gives you details on
– M expressions of each query
– Number of tables and columns in the model
– Number of measures and their expressions
– BUS matrix
– Number of rows in the tables
– Size of tables and columns in the model
– Lineage between data warehouse tables/view to measuresTalk to us if you need help in implementing such a data glossary for your models.
-
-
-
-
-
-
-
Optimize the model
Models in production should always be optimised to ensure they consume less memory and refresh and query faster. Memory is at a premium in Power BI (forgive the pun) so you should always strive to make sure the models only use the bare minimum necessary to meet the reporting requirements. Here are some steps to perform to make sure models refresh faster and consume less memory
– Remove unnecessary columns from tables, especially fact table primary key columns
– Filter rows which are not required for reporting. If there is only a reporting requirement for the last five years, do not include data from 2010 onwards
– Decrease precision of decimal fields to 2 decimal points
– Set MDX as false to non attribute columns (PK, DK, Record_effective)
– Set right encoding for columns – dimension tables should have hash encoding and decimal fields benefit from value
– Custom partition on tables
– Reducing cardinality
– Do not use calculated columns
– Use aggregated tables if detailed grain is not required for reporting
-
-
-
-
-
-
-
Automate semantic model testing
How do you ensure that the measures you have written are correct? How do you know that the business can trust the numbers coming from the measures ? One way to do that is to test your semantic model against the source of the measures which in most cases are views. You can use the Execute Queries API to query your models in production, extract the measure results and compare them against an equivalent SQL statement from the views. If you have a tester they can set up a testing framework in ADF and it can be automated to make sure that the measures are always giving the correct results.
-
So there it is, the end of this series on my musings from developing and deploying enterprise grade semantic models. As a parting note, developing enterprise grade semantic models is an exciting role to work in as you get to collaborate with a wide variety of stakeholders while having ultimate control over the semantic model. Treat it like a product and make sure you listen deeply to the users before adding any new features. Finally, your job as a semantic modeler is to make it easier for the end users to create reports. Provide as much details as possible on how to use it and evangelise it to everyone you meet in the organisation. All the best !
-
-