
There are several articles and books written on how to write better DAX and I have written a fair few as well. This article is not one of them. What will cover in this article are some of the best practices associated with DAX management and housekeeping before we deploy our models to production. They are all important, so make sure to tick them off before you release anything to production
- Use Explicit measures and not Implicit measures
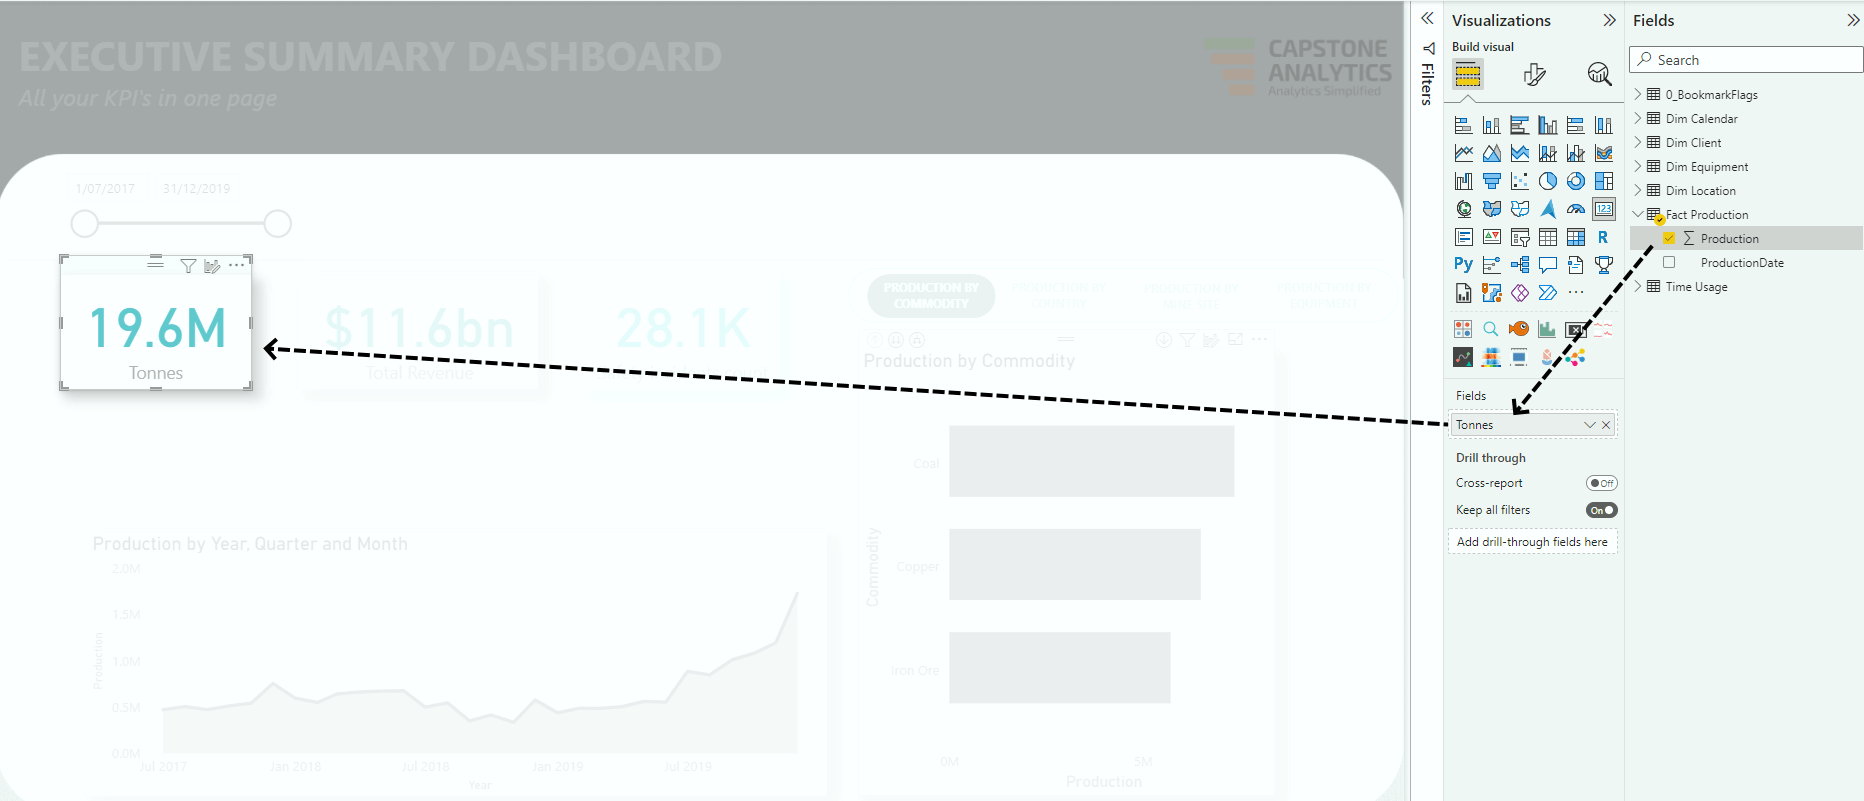
It still amazes me that I come across Power BI models developed by developers who still use implicit measures in their production ready models. Even if you do not follow the other 6 principles, this one simply cannot be skipped. So what are implicit and explicit measures ? Implicit measures are those which make use of the default summarization properties of columns (sum, average, count, max, min etc) to populate a visual. You can drag and drop a column into the ‘Fields’ or ‘Values’ section of a visual and set its summarization type to get your result. As you can see below the Production column has a default summarization set to SUM and is dragged into a card visual and the name changed to ‘Tonnes’ and the visual is populated. Why is this bad ?
The default summarization could have been set to SUM but it could have been changed to AVERAGE when placed under Fields. It’s very hard to audit what the measure is calculating without looking at each column and each visual which can become tedious
Complex measures cannot be defined this way as only basic summarizations are allowed.
The measure cannot be reused since its not explicitly defined.
It cannot be accessed via external tools like Excel, as only explicit measures are visible in those tools.
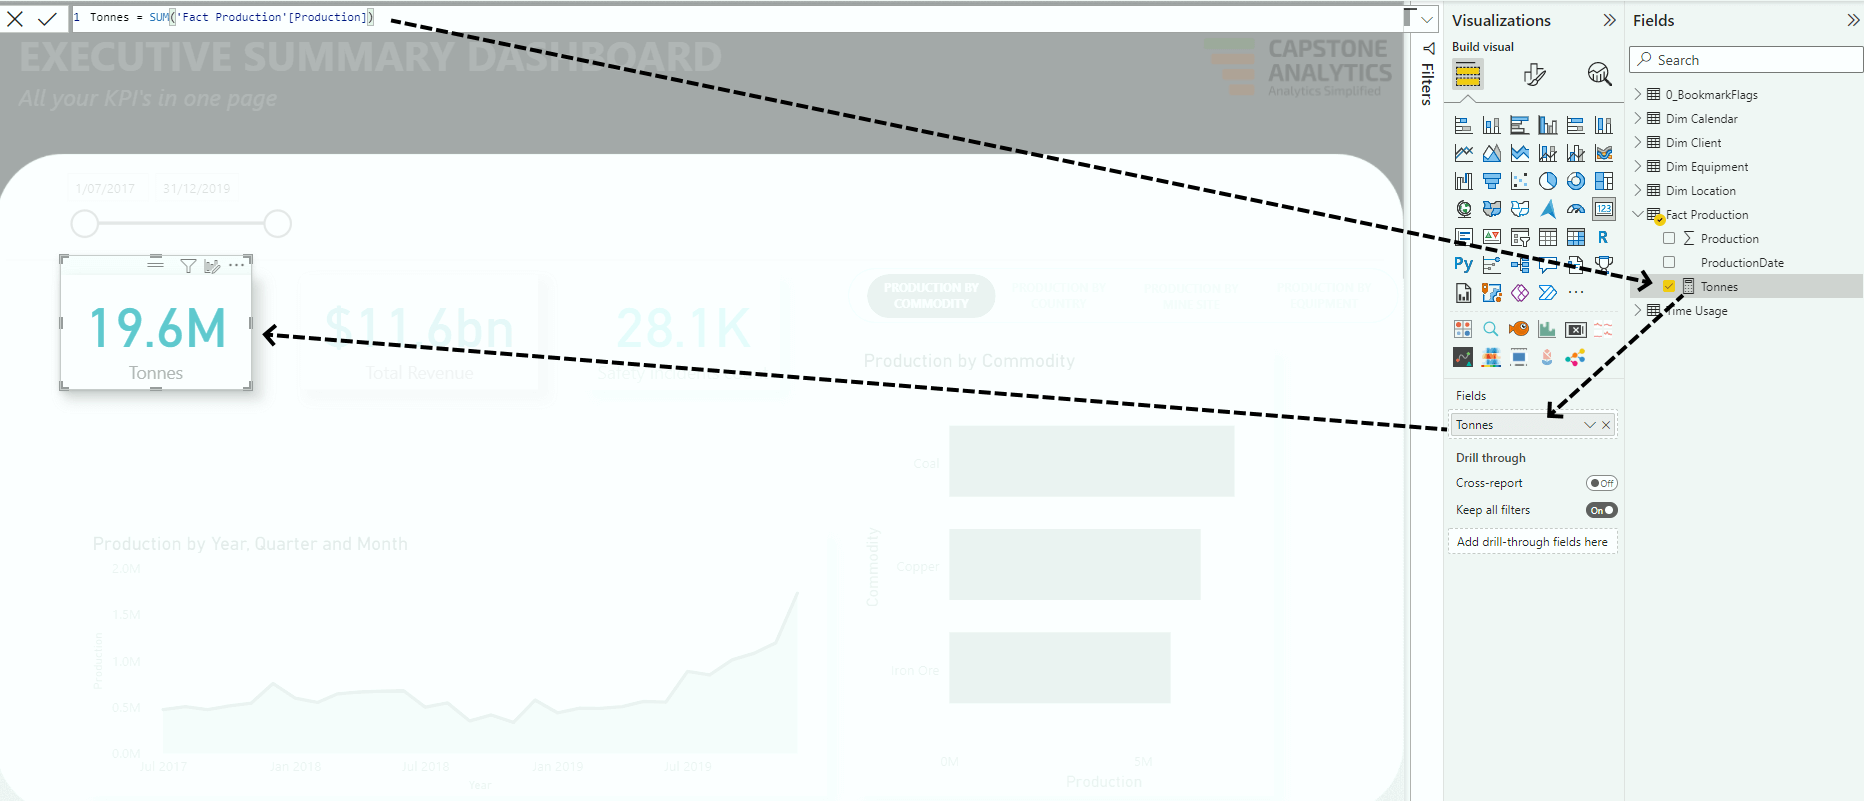
 So then, what are explicit measures ? Explicit measures are the default way measures should be defined in Power BI. And we do that by explicitly writing out the formula in DAX. To redo the above example we write a measure called
Tonnes = SUM ( ‘Fact Production'[Production] )
and place it under ‘Fields’ in the card visual. You can see that there is a clear lineage between the measure definition and the output. Explicit measures are auditable, they can be reused inside other measures, you can author complex DAX measures and other tools like Excel can see them in their environments
- Use Consistent Naming Conventions
Follow a consistent naming convention so that its easier to read. In my projects I tend to use Proper Case , so I would write ‘Sales Amount’ instead of ‘Sales amount’. This is not a hard and fast rule though. But whatever convention you choose adopt it consistently.
- Measures should be performant
Once you have finished authoring explicit DAX measures, and placed them in visuals you need to ensure that they are performant. What does that mean ? You need to ensure that your visuals on a page are loading quickly (not more than 3 seconds) and that the DAX code is not taking long to execute. Thee is nothing worse than designing awesome looking dashboards if the end users find it frustrating to use as it takes a long time for the visuals to load as the DAX code is being executed in the background. This post will not cover how to optimise DAX code as other people have covered it extensively. A good starting point is to use the Performance Analyzer in Power BI and determine which measures are taking the longest to execute and copy the DAX query into DAX Studio for further investigation.
- Format the code
If its not formatted, its not DAX. Consider the code below
Average Sales Per Store = VAR t1 = ADDCOLUMNS ( SUMMARIZE ( FactOnlineSales, DimStore[StoreName] ), “TotalSales”, CALCULATE ( SUMX ( FactOnlineSales, FactOnlineSales[SalesQuantity] * FactOnlineSales[UnitPrice] – FactOnlineSales[DiscountAmount] ), FactOnlineSales[SalesQuantity] > 0 ) ) RETURN AVERAGEX ( t1, [TotalSales] )
Its a lengthy piece of code and its hard to understand what’s going on. So if you find the code hard to read, imagine how hard would it be for someone else who would inherit the model. So do the right thing and format the code using DAX formatter. The formatted code below is cleaner and easier to read and audit
Average Sales Per Store =
VAR t1 =
ADDCOLUMNS (
SUMMARIZE ( FactOnlineSales, DimStore[StoreName] ),
“TotalSales”,
CALCULATE (
SUMX (
FactOnlineSales,
FactOnlineSales[SalesQuantity] * FactOnlineSales[UnitPrice] – FactOnlineSales[DiscountAmount]
),
FactOnlineSales[SalesQuantity] > 0
)
)
RETURN
AVERAGEX ( t1, [TotalSales] )
- Format your measure
It is not just important to format your code, it is also important to format the measure itself. Measures can be formatted as Text, General, Currency, Whole number, Decimal Number, Percentage or Scientific. Use the appropriate formatting for each measure.
- Use comments
Use comments in code to clarify any assumptions made, on which page the measure is being used, if its a temporary measure etc. To activate comments, in a new line in the DAX editor window in Power BI press ‘Ctrl /’ and then type your comments. Below is an example. This makes it easier for you to know where your measures are being used and if they are being used at all.
Tonnes = SUM ( ‘Fact Production'[Production] )
// This is used in the Executive Summary page
- Provide a description and synonyms
A description of what the measure stands for is very useful especially if the model is being used to develop multiple reports. Usually, in corporate a base set of measures will have been defined and validated by the data stewards and data custodians and you can find them in a sharepoint page or confluence page. Copy those definitions and paste them under the description section of the measure. If there are synonyms used make sure to copy them as well.
- Apply appropriate data category
If your measure denotes an address like country or city you can apply the appropriate data category for it. This is important when you want to use the measure in geo spatial visuals so that the visuals correctly identify the location. If you measure contains an URL make sure to either apply a Web URL or an Image URL.
- Test measures against the source
This is especially important in enterprise semantic models where the source of the data is from a database/data warehouse. In such cases you can readily test the outputs of the measures against the equivalent SQL queries from the tables/views. You can automate this by running a testing framework in Azure by calling the Dataset Execute Queries REST API .
- Place the measures in a dedicated measure table
Placing the measures in a dedicated measure table ensure easy access to all the measures. You can call the table something like ‘ALL MEASURES’, ‘BASE MEASURES’, ‘REPORT MEASURES’ etc. You can also group them into different folders for ease of navigation.
- Document your code
Finally it is important to document all the measures you have written in your model or report once you have finalised it. The documented code serves as a final repository of all your DAX which can be easily accessible. There are no automated ways to document your code but tools like Power BI helper can help you in the journey.
You can download a handy pdf reference guide of the eleven rules below
Eleven rules of DAX management