
In Part 3 of the series, we talked about how to solve business problems when you want to filter a measure by attributes from the fact/dimension table and then evaluate an expression. In this series, we continue the conversation and this time we talk about how to filter the tables using numeric and date expressions
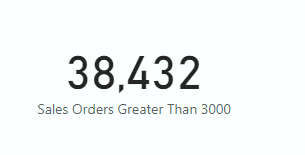
The Business Problem – How many sales orders are greater than $3000
Businesses are often interested in answering what is their given sales/tonnes/profit which is greater than a certain number for a given attribute. This is, so that they can isolate those orders/tonnes/projects and focus on what went right, targeted campaigns etc. Some questions along these lines
- How many excavators produced more than $1M tonnes of Irone Ore ?
- What is the average height of the class of children who are more than 10 years old ?
- Which projects made a loss last quarter ?
So coming back to the original question. This is an interesting one as this requires us to think carefully on how to use the filters. The Sales Amount field is only available in the Fact table, hence we need to filter the FactOnlineSales table to only include sales orders which are greater than $3000 as these are high value orders for the business. Ultimately the business wants to know the % of high value orders. The pattern then becomes
Sales Orders Greater Than 3000=
CALCULATE (
DISTINCTCOUNT ( FactOnlineSales[SalesOrderNumber] ),
FILTER ( VALUES ( FactOnlineSales[SalesOrderNumber] ), [Total Sales] > 3000)
)
The result then becomes
The pattern for the % high value orders becomes
% of High Value Orders =
DIVIDE (
[Sales Orders Greater Than 3000],
DISTINCTCOUNT ( FactOnlineSales[SalesOrderNumber] )
)
The result then becomes
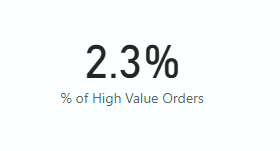
So, only 2.3% of sales orders have sales greater than 300
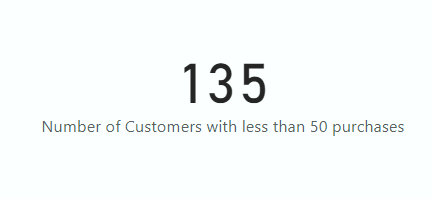
The Business Problem – How many customers made less than 50 purchases ?
This problem uses the similar pattern to the above but instead of using columns from the fact table it uses dimension table columns as a filter in the calculate function.
We first need to define the number of purchases
Number of Purchases = DISTINCTCOUNT ( FactOnlineSales[SalesOrderNumber] )
We then define the final measure where we use the above measure to filter the customers from the DimCustomer table
Number of Customers with less than 50 purchases =
CALCULATE (
DISTINCTCOUNT ( FactOnlineSales[CustomerKey] ),
FILTER ( VALUES ( DimCustomer[CustomerKey] ), [Number of Purchases] < 50 )
)
The result then becomes
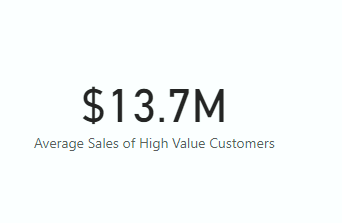
The Business Problem – What is the average amount spent by customers whose annual income is greater than $150K and who spent more than $10M across all years
In this pattern we will discuss multiple numeric filters and apply some of the logic we have seen in previous series. The patterns answers questions along these lines
- How many cars were sold in 2021 whose engine capacity is more than 2L and customers spent more than $50,000 per car ?
- What were the loss making stores of last year who sold more than $1M items ?
- How many projects made a profit in 2020 where they had less than 10 people working per project ?
So lets talk high value customers. High value customers are those whose annual income is greater than $150,000 and who have spent more than $10M over the years. The business wants to know their average sales so that they can do some modelling and forecast how much more can these customers spend so that they can target their marketing campaigns on them. Astute readers will note that anyone who is on say $160K annual income will never be able to spend $10M on a particular stores(s). But knowing that this is a dummy dataset, we will ignore the absurdity of the data distribution and go ahead and solve the problem.
The patten then becomes
Average Sales of High Value Customers =
CALCULATE (
AVERAGEX ( VALUES ( DimCustomer[CustomerKey] ), [Total Sales] ),
DimCustomer[YearlyIncome] > 150000,
FILTER ( VALUES ( DimCustomer[CustomerKey] ), [Total Sales] > 10000000 )
)
Summary
In this fourth part of the series, we have seen how to filter fact tables by using a measure to filter dimension/fact tables. Use the following patterns to answer the following questions.
Any problem involving the filtering measures in the fact table by iterating a measure across dimension/fact tables.
- How many sales orders are greater than $3000 ?
- Which projects made a loss last quarter ?
- How many customers made less than 50 purchases ?
While iterating over a fact table use this pattern
Sales Orders Greater Than 3000=
CALCULATE (
DISTINCTCOUNT ( FactOnlineSales[SalesOrderNumber] ),
FILTER ( VALUES ( FactOnlineSales[SalesOrderNumber] ), [Total Sales] > 3000)
)
While iterating over a dimension table use this pattern
Number of Customers with less than 50 purchases =
CALCULATE (
DISTINCTCOUNT ( FactOnlineSales[CustomerKey] ),
FILTER ( VALUES ( DimCustomer[CustomerKey] ), [Number of Purchases] < 50 )
)
Any problem involving the filtering measures in the fact table by a combination of filtering by dimension attributes and iterating a measure across dimension/fact tables.
- How many customers under the age of 30 spend $50k in 2021 ?
- How many accounts had accumulated less than $50k in interest where the annual income of customers was over $500k ?
- How many stores had less than 50 employees and made a profit last financial year ?
Average Sales of High Value Customers in 2021 =
CALCULATE (
AVERAGEX ( VALUES ( DimCustomer[CustomerKey] ), [Total Sales] ),
DimCustomer[YearlyIncome] > 150000, DimDate[CalendarYear] = 2021,
FILTER ( VALUES ( DimCustomer[CustomerKey] ), [Total Sales] > 10000000 )
)