
0In Part 4 of the series, we talked about how to solve business problems when you want to filter a measure using numeric and date expressions. In this series, we go to the next level of business problems where we discuss problems involving % of the total. These kind of problems are solved easily in Excel but it requires advanced DAX knowledge to solve it in Power BI. We will be using the ALL family of functions to solve this problem.
The Business Problem – What is Australia’s share of global export coal revenue
This problem involves calculating % of the total and is a common problem which needs to be solved in a business. Some other problems along the same lines:
- What is the % profit for each store last financial year
- How much rainfall in % did Brisbane get this year among the top 5 Australian cities
- What is the % of electric vehicles among all cars sold in Australia in 2021
For this problem we will be using data from this website which gives the top 15 coal exporting countries by revenue which account for 98.6% of global coal exports in 2021. The data model is shown below
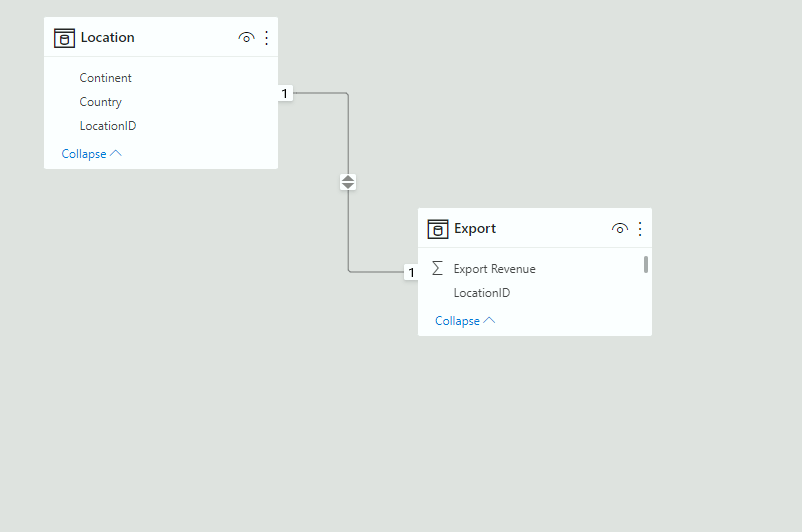
Before calculating the measure for the % of the total we need to calculate the total, in this case the total export revenue
Export Revenue ($) =
SUM ( ‘Export'[Export Revenue] )
For the first iteration of the % of total we calculate the measure as
Export Revenue % v1 =
DIVIDE (
[Export Revenue ($)],
CALCULATE ( [Export Revenue ($)], ALL ( Location ) )
)
In the denominator we are using ALL ( Location ) to remove any filters coming from the Location table and by doing that we get the total export revenue in the denominator. So for each country the numerator is the export revenue of that country and the denominator is the total export revenue and the ratio gives the %.
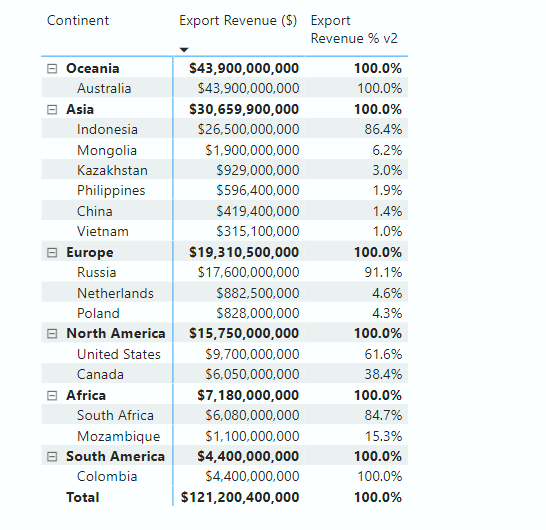
We place this two measures in a table visual along with the column ‘Country’ and we get
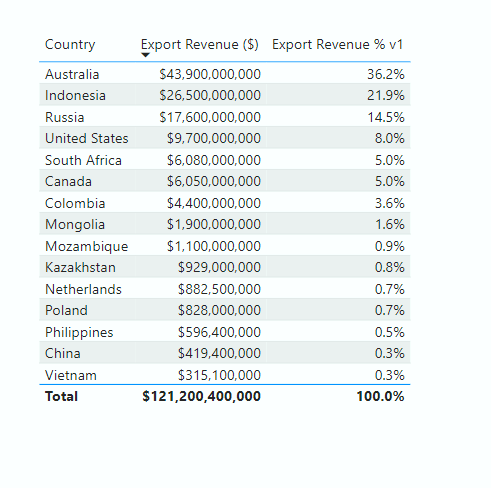
So, to answer the question, Australia’s share of the global coal revenue is 36.2% in 2021.
Let’s add some complexity and start asking more questions
The Business Problem – What is the export coal revenue for Asian countries as a percentage of Asia’s revenue
There are six countries in Asia in the model- Indonesia, Mongolia, Kazakhstan, Philippines, China, and Vietnam. The problem is to calculate the export coal revenue of each of those countries as a % of Asia’s revenue. We have the column ‘Continent’ available to us in the model, so we drag it into a slicer and select Asia and this happens
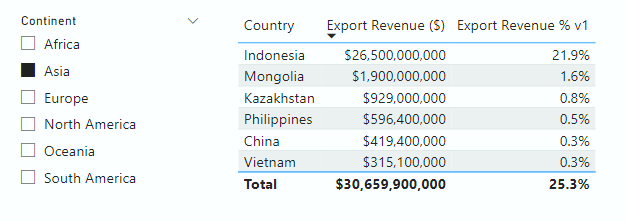
Not quite the result we expected for the Export Revenue % v1 measure. Why is that ? Recall that the denominator of the DIVIDE function in the measure uses ALL ( Location )which removes filters from the Location table. Hence, even though we select Asia from the Continent column which is in the Location table, the filter from that column is removed giving all the rows of that table. Hence we get the % of the global export coal revenue and not Asia’s. We need to define another measure which retains the filters coming from the Continent column. We define it as below
Export Revenue % v2 =
DIVIDE (
[Export Revenue ($)],
CALCULATE ( [Export Revenue ($)], ALLSELECTED ( Location[Country] ) )
)
We have replaced ALL ( Location ) with ALLSELECTED ( Location[Country] ). What this does is gives all the rows from the selection, in this case we have selected ‘Asia’ from the ‘Continent’ column and this filter is applied on the measure and we get all the countries under ‘Asia’. Thus the denominator is the sum of the export revenue for Asia which is $30.66 bn.
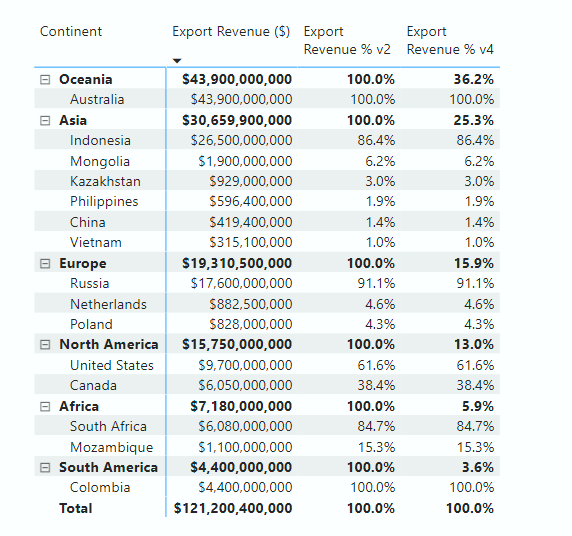
We place this measure in the same visual as above and get the below
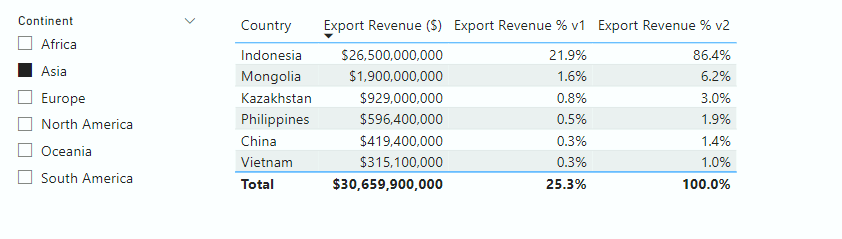
This is exactly the result we wanted. Indonesia has the biggest % share for all Asian countries at 86.4% followed by Mongolia at 6.2%. You can select any Continent in the slicer and the Export Revenue % v2 measure gives the % for the countries in that continent.
Let’s add a twist to the problem. What if we place Continent into the visual above and convert it into a matrix visual and expand to the lowest level (Country). From here on we would only be focusing on the v2 measure. The visual would look like this:
What we now have is that the % for the countries are correct but the % for the continents are wrong. Why is that ? Because in the denominator of the DIVIDE function the filter for continent is still present. Hence the numerator and denominator are one and the same and the ratio is 1. We need another set of measures which gives the correct % for the countries as well as the continents. WE define another measure which we wont be using in the visual but will be used in the subsequent v4 measure.
Export Revenue % v3 =
CALCULATE ( ‘Export'[Export Revenue ($)], ALLSELECTED ( Location[Continent] ) )
The above measure is used in the v4 measure which is defined as follows
Export Revenue % v4 =
IF (
ISINSCOPE ( Location[Continent] ) && NOT ( ISFILTERED ( Location[Country] ) ),
DIVIDE ( [Export Revenue ($)], [Export Revenue % v3] ),
[Export Revenue % v2]
)
This measure has two parts. The first part applies to the rows in the visual with continents filtered and the second to the rows in the visual with countries filtered. The measure is placed in the visual and it looks like this
This is exactly what we wanted and we can clearly see the difference between v2 and v4 measures. The v4 measure uses the v3 measure as a denominator in the DIVIDE function. And the denominator has ALLSELECTED ( Location[Continent] ) which removes filters from selected continents. We could have used ALL( Location[Continent] ) as well and achieved the same result as above but the difference is that when we select more than one Continent from a slicer it would not have worked. Let us do just that. We will select Europe and North America from the Continent slicer and see what the visual does
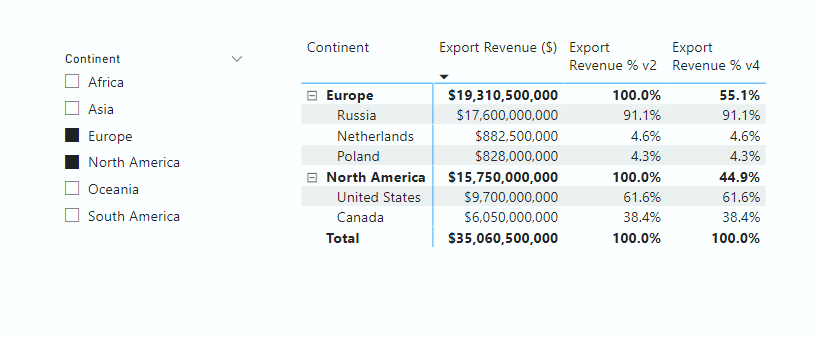
The reason for using ALLSELECTED ( Location[Continent] ) is now clear. When we select ‘Europe’ and ‘North America’ from the Continent slicer we get the % revenue of Europe and North America of their combined total.
Let us add another twist to this. For the set up above what we wanted to show the export revenue for each country as the % of ALL the counties in the selection regardless of the continent they are in. For ex: we want to know the % of United States as $9.7/$35.06. For this we define our final measure as below
Export Revenue % v5 =
IF (
ISINSCOPE ( Location[Continent] ) && NOT ( ISFILTERED ( Location[Country] ) ),
DIVIDE ( [Export Revenue ($)], [Export Revenue % v3] ),
DIVIDE (
[Export Revenue ($)],
CALCULATE ( [Export Revenue % v3], ALLSELECTED ( Location[Country] ) )
)
)
Here, in the second part of the IF statement in the denominator of the DIVIDE function we remove all filters from the selected countries which would give us the total of $35.06 for all the countries and the numerator would the export revenue for that particular country. The final visual looks like this
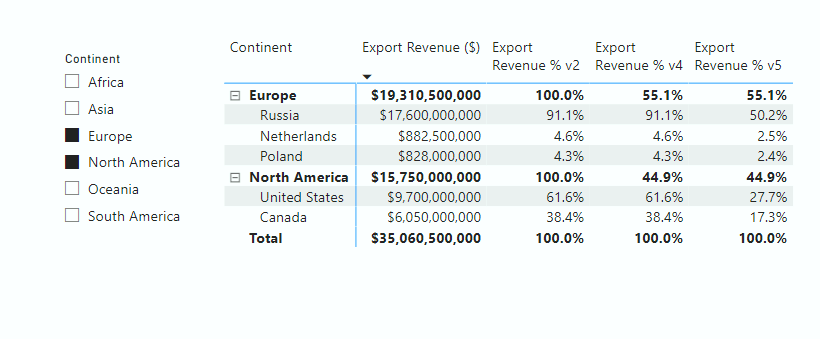
You can see that the % of United States coal revenue for all the countries in Europe and North America is 27.7%
Summary
In this fifth part of the series, we have seen how to use the ALL family of functions to calculate % of totals for various business requirements
Any problem involving the calculation of % of total values
- What is Australia’s share of global export revenue
- What % of garments are manufactured in China ?
- What is Amazon’s share of global electronics sales ?
Australia’s share of global export revenue=
DIVIDE (
[Export Revenue ($)],
CALCULATE ( [Export Revenue ($)], ALLSELECTED ( Location[Country] ) )
)
When Continent is added as the top most hierarchy in a visual, to get the share of each country as the % of the Continent total
IF (
ISINSCOPE ( Location[Continent] ) && NOT ( ISFILTERED ( Location[Country] ) ),
DIVIDE ( [Export Revenue ($)], CALCULATE ( ‘Export'[Export Revenue ($)], ALLSELECTED ( Location[Continent] ) ) ),
[Export Revenue % v2]
)
When Continent is added as the top most hierarchy in a visual, to get the share of each country as the % of the selected Continents’ total
IF (
ISINSCOPE ( Location[Continent] ) && NOT ( ISFILTERED ( Location[Country] ) ),
DIVIDE ( [Export Revenue ($)], CALCULATE ( ‘Export'[Export Revenue ($)], ALLSELECTED ( Location[Continent] ) ) ),
DIVIDE (
[Export Revenue ($)],
CALCULATE ( [Export Revenue % v3], ALLSELECTED ( Location[Country] ) )
)
)