
For the past one year, I have been fortunate enough to work on a digital transformation project for one of Australia’s largest superannuation funds to develop enterprise grade semantic models. I worked with a wonderful team comprising Solution Architects, Information Architects, Data Modelers, Data Stewards, Product Champions, Business Intelligence Analysts, Testers, Report Developers, and Delivery Managers to ideate, design, test, deploy, and document semantic models which contained superannuation data for the funds’ members. It was an exciting project with lots of challenges and lots of learnings. So I thought I would make a blog post to share the learnings with everybody.
Firstly, what is a semantic model ? Before we get to the semantic model we need to understand its relationship with respect to the semantic layer. According to Wikipedia:
A semantic layer is a business representation of corporate data that helps end users access data autonomously using common business terms. A semantic layer maps complex data into familiar business terms such as product, customer, or revenue to offer a unified, consolidated view of data across the organization
The above definition is as good as it gets without the use of unnecessary jargon. So we will stick with this going forward. Where does the semantic layer sit in a modern BI/analytics landscape. The below simplified architecture answers the question. This is for a Power BI landscape but would work similarly with other tools.
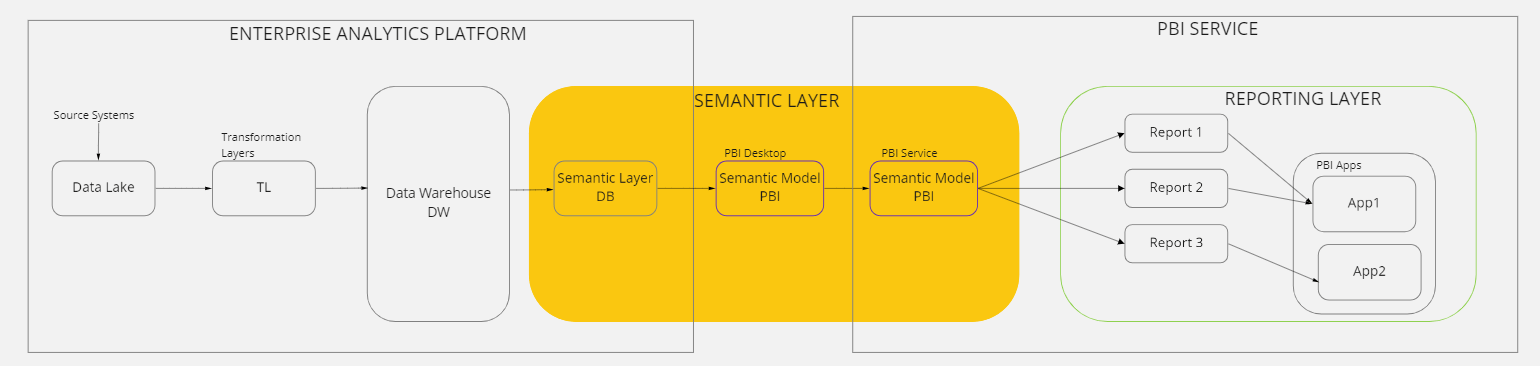
So as you can see, the semantic layer is that layer which sits between the data warehouse (which is the output of the Transformation Layers) and the reporting layer. The semantic layer consists of two parts
-
- Semantic Layer DB – These are the SQL views which are created in the database from the Fact and Dimension tables. The views can be a one-to-one copy of the tables or they can be enhanced with fields containing report level logic. It is in these views that business friendly names are given to the fields. So instead of ‘MemberName’ we would have ‘Member Name’ as a field. It is important that no business transformations are applied in the views. All transformations are to be applied in the transformation layers and the data loaded to the data warehouse.
-
- Semantic Model PBI – The views are imported into a Power BI Desktop model which is called the semantic model. Corporate measures, which have been defined by data stewards are then calculated in the model. Most of these measures are simple aggregations of fields in the tables (SUM, DISTINCTCOUNT). The semantic model is then published to PBI service where report developers connect to it, design reports and share via apps. The semantic model is the ‘single version of truth’ and is used as the primary data source for enterprise reports. In this example, all superannuation related reports would connect to this model to generate insights. It is the design and deployment of this semantic model which would be the focus of this series of blogs.
So in essence, in the PBI world, the semantic model is a dataset with corporate measures, used to query organisational metrics. The reports which query the dataset are in fact ‘Thin Reports’, with the report developers having the ability to create report level measures. In the simplest architecture the dataset contains many datamarts and the data is imported into the model. All datamarts have a star schema associated with them.
So why build the semantic model after all ? There are several reasons why an organisation should implement a semantic model. The key reasons are given below
-
-
Single Version of Truth (SVOT)
When implemented correctly, the semantic model provides accurate and trustworthy data for key organisational metrics which serve as the SVOT no matter which tool is used to query it. Because the metrics have been defined in consultation with relevant stakeholders from the business, any report connecting to the model and querying the metrics (in the form of measures) produces the same result. This is quite powerful as there is no longer confusion on what the metrics mean, and everyone will be on the same page discussing the reports.
-
-
-
Seamless collaboration
A semantic model allows for creation of a data model which is a visual description of the business for analyzing, understanding, and clarifying the data and the associated relationships. This model can not only be used by the business to generate insights but can also be used by data scientists to complement the raw data which they use in their models. Composite models, which are models which are created by combining the semantic model with business unit specific data (say salary data) can also be created and shared with the relevant stakeholders. Thus the creation of the semantic model enables easy authoring, sharing, and collaborating of data models and insights.
-
-
-
Reduce computing costs
With most business running their data warehouses in the cloud, ad-hoc querying the data warehouse for every report leads to poor workload management and long running queries being run multiple times. With a cached semantic model, only optimised queries (via views) which are at the grain required for business reporting are run, which improves query performance and reduces costs.
-
-
-
Simplify DAX calculations
The semantic model is structured in such a way that measures in the model are simple aggregations of the columns in the views. Since all the transformations are done prior to data being loaded into the data warehouse and report specific logic being implemented in the views, writing DAX to create either the corporate measures or report level measures becomes easier. This is why it is important to have solution architects and data modelers in your team who would make sure that the views are at the right grain and fit for purpose for reporting.
-
-
-
Improved security
Users can be authenticated to use the semantic model with Azure AD groups and further, Row Level Security can be implemented at both the DB level and at the dataset level to protect sensitive data and limit access to data for users based on their roles in the organisation.
-
So what constitutes an enterprise grade semantic model ? In my opinion, the following conditions should be satisfied for a model to be classified as enterprise grade
-
-
Represent data from a business unit
The semantic models which I designed enabled end users to query data related to the members of the superannuation fund. Metrics such as Member Count, Exited Member Count,Member Account Balance, New Join Count etc could be queried from the model by slicing them with dimensions such as Member, Age Bracket, Employer, Payment Institution, Amount Bracket etc. In short, the relevant business unit in this case was Superannuation and the semantic model contained almost all the data required by the business to attract and retain members into the fund. Normally there is an executive sponsor who funds the project to set the ball rolling.
-
Governed corporate measures
It doesn’t make sense to model the data from a business unit if there is no consensus on the definitions of the corporate metrics. It is important that even before conceptualising the data platform, a thorough process is undertaken to define the most important corporate metrics and get them approved by the relevant stakeholders. This can be facilitated by setting up a Data Office in the organisation which is responsible for signing off on the corporate measures based on the approved definitions from the stakeholders.
-
Architecting the solution
So, you have identified which business unit’s data to model and have also got sign offs on the corporate metrics which need to be the output of the model. It is then critical to start brainstorming on how the solution would look like. This is where the Architects come into play. Most enterprise data reside in databases in different source systems. The architects will perform a detail analysis on what is the current state of the source systems, the best way to extract the data from the source systems, selecting the appropriate cloud platform for the solution, and designing the conceptual and logical design in tandem with the Data Modelers. The data warehouse is then built by the data engineers based on the specifications given to them by the Data Modeler. The semantic model is then designed from the data in the data warehouse based on the reporting requirements of the business. One of the core architectural principles is that any reusable logic (columns) should be applied as close to the source as practical. ie, there should be no columns defined in Power Query or in the Power BI model. If the solution is not architected, then it is not an enterprise grade model.
-
-
-
Deliver fast queries
Once the solution is architected and the corporate measures have been defined in the model based on the business definitions, it is time to deploy the model. If the reports connecting to the semantic model cannot query a measure in less than 3 seconds (nothing scientific about measures being able to run in less than 3 seconds, just a number which was felt good enough at the time of deployment), then it is time to go back to the drawing board. The semantic model should be fast enough to respond to the needs of the business. A slow model will impede adoption and people will lose trust in the efficacy of the model.
-
Hopefully this article has piqued your interest in all things enterprise semantic modelling using Power BI – They Why’s and the What’s. In the next series of articles, I will share about the learnings I gained from developing and deploying enterprise grade semantic models. Some will be general, and others will be technical. Hope you find them useful too.