This is the fifth post in the Strategic colouring in Power BI series. Links to all the posts can be found here
https://capstoneanalytics.com.au/master-post-for-strategic-colouring-articles/
In the fourth post, we discussed how to isolate and visualise YTD data
In this post we will discuss how to visualise differences in sales for various categories in a field (Segment) across all the years in a model from a base year.
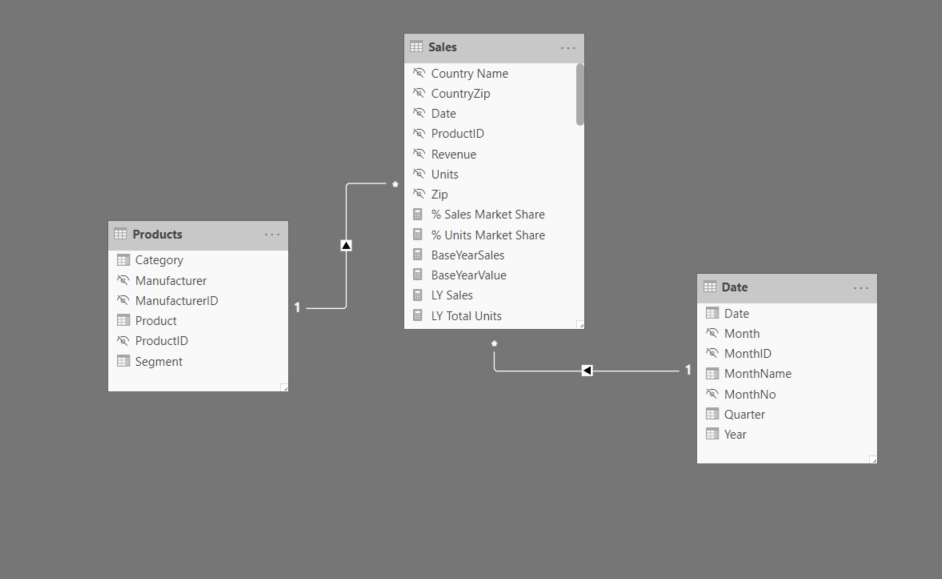
Our model has one fact table Sales and two dimension tables Date and Product

Define Total Sales as
Total Sales =
SUM ( Sales[Revenue] )
Next we will create a copy of the Date table and call it Date 2 and define these three measures
SelectedBaseYear =
SELECTEDVALUE ( ‘Date 2′[Year] )
BaseYearValue =
IF ( [SelectedBaseYear] = SELECTEDVALUE ( ‘Date'[Year] ), 0, BLANK () )
BaseYearSales =
CALCULATE ( [Total Sales], TREATAS ( VALUES ( ‘Date 2′[Year] ), ‘Date'[Year] ) )
SelectedBaseYear gives the Year when selected from a slicer. BaseYearValue will be used to highlight the SelectedBaseYear in the chart. BaseYearSales gives the Total Sales for the SelectedBaseYear
Now we define the variance measures
VarianceFromBaseYearNegative =
VAR diff = [Total Sales] – [BaseYearSales]
RETURN
IF ( diff < 0, diff, 0 )
VarianceFromBaseYearPositive =
VAR diff = [Total Sales] – [BaseYearSales]
RETURN
IF ( diff > 0, diff, 0 )
We also need to calculate the Maximum and Minimum differences so that we can highlight them in the chart
MaxPositiveDifference =
VAR baseyearsales = [BaseYearSales]
VAR result =
CALCULATE (
MAXX (
SUMMARIZE ( Sales, ‘Date'[Year], “Variance”, [Total Sales] – baseyearsales ),
[Variance]
),
ALL ( ‘Date'[Year] )
)
RETURN
IF ( result = [VarianceFromBaseYearPositive], result, 0 )
MaxNegativeDifference =
VAR baseyearsales = [BaseYearSales]
VAR result =
CALCULATE (
MINX (
SUMMARIZE ( Sales, ‘Date'[Year], “Variance”, [Total Sales] – baseyearsales ),
[Variance]
),
ALL ( ‘Date'[Year] )
)
RETURN
IF ( result = [VarianceFromBaseYearNegative], result, 0 )
Now we need to calculate two more measures so that we dont double up on the numbers
PositiveVarianceWithoutMax =
IF (
[VarianceFromBaseYearPositive] = [MaxPositiveDifference],
0,
[VarianceFromBaseYearPositive]
)
NegativeVarianceWithoutMax =
IF (
[VarianceFromBaseYearNegative] = [MaxNegativeDifference],
0,
[VarianceFromBaseYearNegative]
)
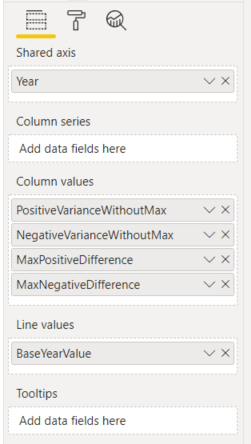
Drag a Line and Stacked Column chart into a blank canvas and drag the following fields (Year is from Date table)

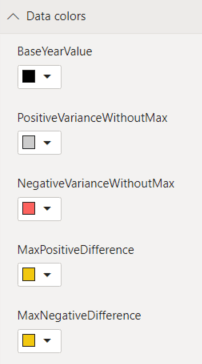
The colours are formatted to something similar

Now drag Year from Date 2 table and drag it into a slicer and make it single select
Also drag Segment from Product table and drag it into a slicer and make it single select
Now you can select the Year which will serve as the Base Year and select different categories in the Segment field to look at the variances.
Link to interactive report here
