
Welcome to the first part of the series on “How to solve problems using DAX”. I spent a lot of time last year posting DAX challenges on LinkedIn which not only covered DAX functions such as CALCULATE, FILTER, TOPN, RANKX but also concepts such as context transition and expanded tables. The challenges were not only well received by the community but they also helped me to fill the gaps in my knowledge of DAX.
So this year I wanted to expand on that by starting a series which would talk about how to use the various concepts and functions of DAX to solve business problems. Its one thing to know the inner workings of DAX but even with all the knowledge, sometimes DAX users fail to apply the correct functions while solving problems. This results in poorly written code which is not performant and worse, gives incorrect results. Hence the purpose of this blog.
I hope to standardize some patterns which can be used to answer various business problems like ” What is the total sales of all products for all years across all regions”, “How many units of Product A were manufactured in 2021″, ” What are the top 10 Stores in Category A for Size P” etc. The focus is not on understanding of the DAX functions per se (it is assumed that the reader has a very good understanding of the most common DAX functions) but rather, given a business problem how to write effective DAX that is not only readable and performant but which also answers the question correctly. At the end of each Part, a summary pattern will be given which can be used to answer the business problem posed at the start of the blog.
Each part of the series will be dedicated to a business problem and various DAX formulae will be provided to answer the problem. Where possible, a often used but wrong solution will also be provided and explanation given as to why that solution is incorrect.
The Data Model
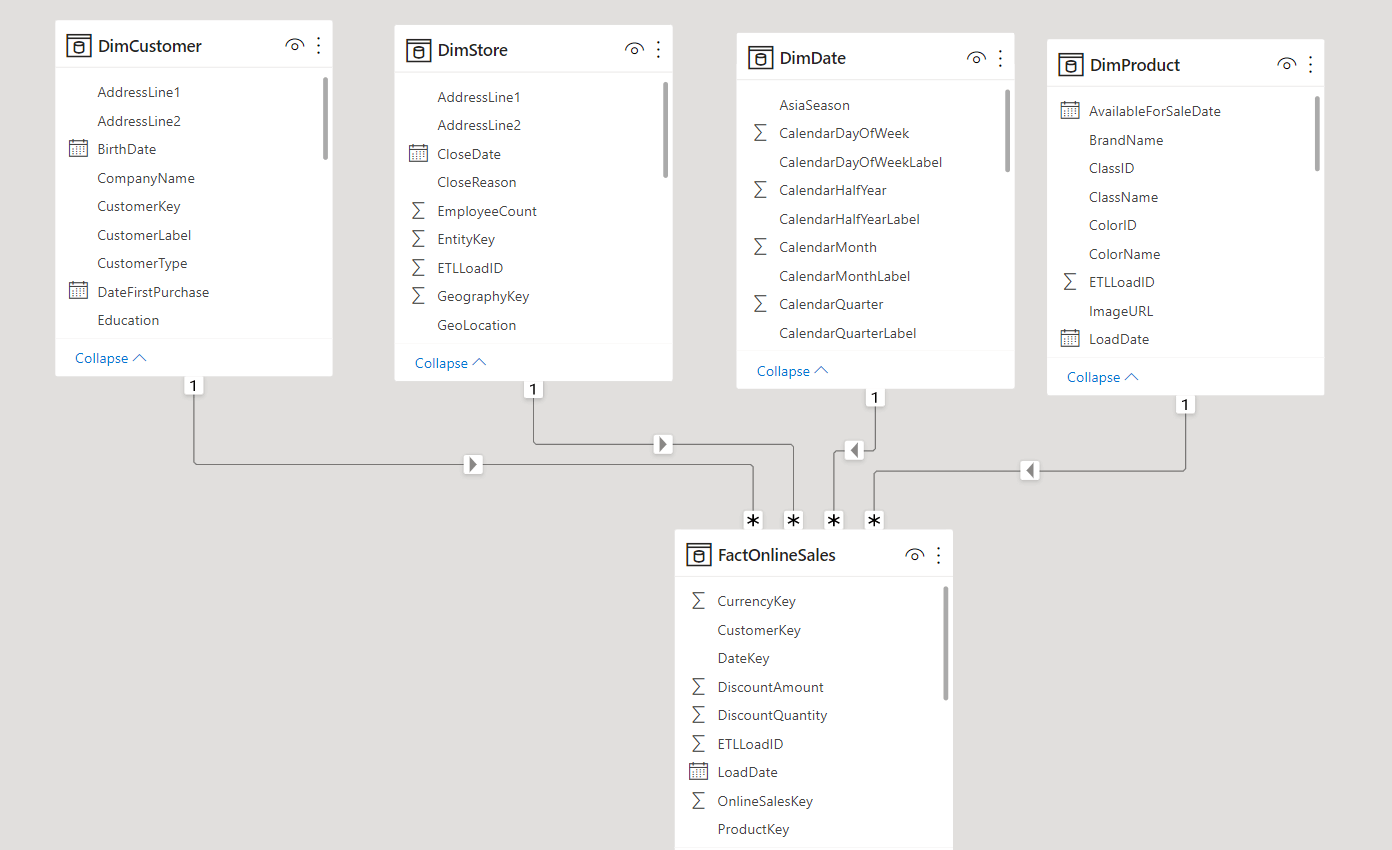
We will be using the Contoso database imported into Power BI as our data model. Contoso is a demo database provided by Microsoft which has a few fact tables on retail sales and dimension tables like Customer, Product, Store etc. We will be using FactOnlineStore as our Fact table and DimCustomer, DimDate, This is a typical star schema which is the recommended model for Power BI reports. If you do not have a star schema for your reports make sure to convert them to a star schema before continuing with this series. The model looks like this
The Business Problem – Total Sales
We will start with the most basic question asked in a Power BI report. This generally goes like this
- What is the total sales
- What is the total tonnes produced
- What is the total number of units manufactured
This can be answered by using the SUM function like this
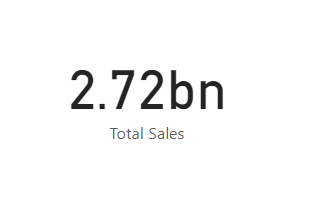
Total Sales = SUM ( FactOnlineSales[SalesAmount] )
The measure [Total Sales] can be used in a card, line chart, bar chart etc. If we want to use it in a card drag a card visual onto a blank page and drag the measure under Values.
If you want to use it in a line chart or a bar chart you can use the appropriate fields from any of the dimension tables. A typical line chart and bar chart with this measure looks like this
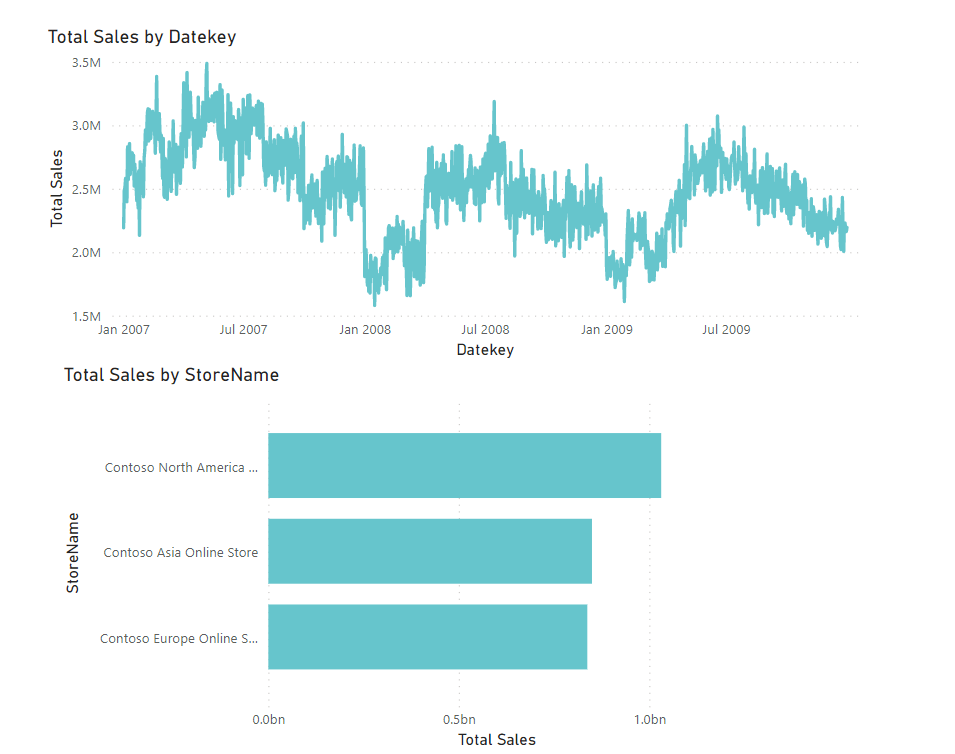
Thus we can see that, from a basic pattern like SUM we can produce multiple visualisation from a start schema model and gain valuable insights
The Business Problem – What is the maximum/minimum discount given ?
A closely related business problem goes like this
- What is the maximum/minimum discount given ?
- What is the highest/lowest temperature ?
- What is the maximum/minimum sales calls made ?
A business would be interested to know what is the most/least amount of discount given for a sales order in order to better understand their profit margins. These can be answered using the MAX/MIN functions. To get the maximum discount amount in our model we need to figure out which field to use. in the model the DiscountQuantity field gives the discount that is given to any sales order. We can use this field to get the maximum discount given
Maximum Discount = MAX ( FactOnlineSales[DiscountAmount] )
This gives the following result in the model

In the same way we can determine the minimum discount given
Minimum Discount = MIN ( FactOnlineSales[DiscountAmount] )
This gives the following result in the model

Hence whenever we are dealing with determining the maximum/minimum values of a column we need to use the MAX/MIN over the column. In future parts we will look at some more complex business problems where we will have to determine the maximum/minimum at a grain higher than that of the model.
The Business Problem – What is the unique number of products sold ?
In the previous section we looked at summing sales/quantities and determining the maximum/.minimum of a field, In this section we will look at a common business problem of the likes of
- What is the unique number of products sold
- How many months worth of data does the model contain ?
- How many unique customers made purchases ?
Each of these questions can be answered by using the DISTINCTCOUNT function. So in our model if we have to determine how many unique products have been sold we need to look at the FactOnlineSales table and find the column which is in a many-to-one relationship with the DimProduct table. We have exactly such a column and its called ProductKey. Since each product could have been bought multiple times we need to find the distinct count of the ProductKey field from the FactOnlineSales table.
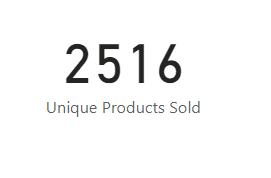
Unique Products Sold = DISTINCTCOUNT ( FactOnlineSales[ProductKey] )
This gives the following result in the model
A wrong solution to the problem is to count the number of Products in the DimProduct table. This may not give you the right answers as there might be products for which there have been no sales recorded. For educational purposes the formula is given but the reader is advised not to use it.
Unique Products Sold WRONG = COUNT ( DimProduct[ProductKey] )
This gives the following result in the model
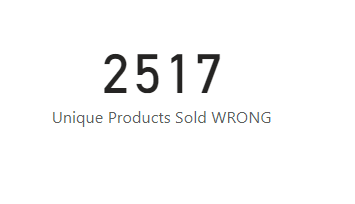
We see that the number of products in the model is not equal to the unique products sold. The fact that they only differ by 1 is due to the demo model being used. In real life models the difference would be higher.
Let’s tackle a slightly dificult problem and answer the question “How many months worth of data is present in the model” ?. Ideally we would have liked a CalendarMonth column in the format yyyymm to be included in the FactOnlineSales table so that we could do a DISTINCTCOUNT over it and get the results. But the CalendarMonth column is only present in the DimDate table and there is no point in reproducing it in the Fact table just to answer this question. So then how do we calculate it ? We need to use the CALCULATE function and also use the concepts of Expanded Tables. If you need to learn these concepts in detail please go though the articles on www.SQLBI.com for indepth explanations of those concepts. For our purpose we will define this measure.
Months of Data Available = CALCULATE ( DISTINCTCOUNT ( DimDate[CalendarMonth] ), FactOnlineSales )
This gives the following result in the model

This works because when you put a Fact table in the second argument of CALCULATE, it creates a left join with all the dimension tables joined to it whereby ‘expanding’ the Fact table. Since the left join contains all the rows of the Fact table, the columns of the dimension table which are joined to this expanded Fact table also contain the same rows. Hence when you do a DISTINCTCOUNT over the CalendarMonth column from the DimDate you only get months for which there is sales data in the model.
SUMMARY
In this first part of the series on how to solve business problems using DAX we have covered some of the most basic business problems covered in a Power BI report and provided DAX formulas for each of them. Use the following patterns to answer the following questions.
Any problem involving summing sales, quantity, measurement and if the questions are like the following
- What is the total sales
- What is the total tonnes produced
- What is the total number of units manufactured
Total Sales = SUM ( FactOnlineSales[SalesAmount] )
Any problem involving calculating maximum/minimum over a column and if the questions are like the following
- What is the maximum/minimum discount given ?
- What is the highest/lowest temperature ?
- What is the maximum/minimum sales calls made ?
Maximum Discount = MAX ( FactOnlineSales[DiscountAmount] )
Any problem involving calculating the unique values of a column and if the questions are like the following
- What is the unique number of products sold
- How many months worth of data does the model contain ?
- How many unique customers made purchases ?
Unique Products Sold = DISTINCTCOUNT ( FactOnlineSales[ProductKey] )
If the column to be used is in the dimension table use this pattern
Months of Data Available =CALCULATE ( DISTINCTCOUNT ( DimDate[CalendarMonth] ), FactOnlineSales )