
In Part 1 of the series, we looked at some patterns to solve business problems which involved calculating total sales, maximum discount, unique products sold etc. In this Part, we will look at some patterns which involve calculating averages and also discuss some common pitfalls.
The Business Problem – Average Sales
A common business problem is to determine the average sales. Some other problems along the same lines
- What is the average rainfall ?
- What is the average temperature ?
- What is the average queue time ?
Averages can be tricky to compute in Power BI. For an average we need a numerator and a denominator. However, in Power BI we have functions to calculate averages and we only need to specify the column over which the average is performed. Coming back to our model, the FactOnlineSales table is at the granularity of SalesOrderLineNumber. This means that for every SalesOrder we can have multiple items which have thier own SalesOrderLineNumber. So when we say “Give me average sales amount” do we mean “average sales by sales order line number” or “average sales by sales order” ? Most likely we are interested in average sales by sales order. And they use different formulae. If you want to calculate “average sales by sales order line number” we just use the AVERAGE function over the SalesOrderLineNumber column
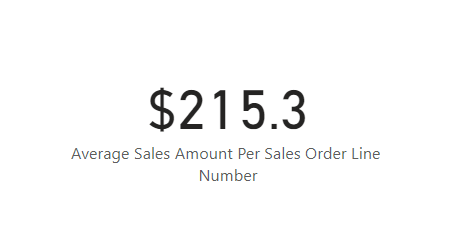
Average Sales Amount Per Sales Order Line Number = AVERAGE ( FactOnlineSales[SalesAmount] )
This gives the following result
In order to calculate “average sales by sales order” we need to use the AVERAGEX function which is an iterator. We know that we need the average sales for SalesOrderNumber, hence we use it in the first argument of AVERAGE and the pattern becomes
Average Sales Amount Per Sales Order = AVERAGEX ( VALUES ( FactOnlineSales[SalesOrderNumber] ), [Total Sales] )
This gives the following result
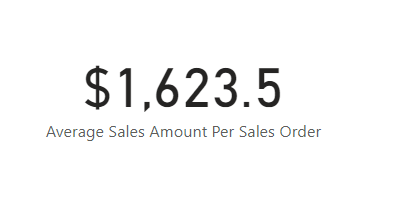
We can see that the Average Sales Amount Per Sales Order is greater than Average Sales Amount Per Sales Order Line Number. This makes sense as the sales order amount is greater than its sales order line number amount.
The Business Problem – Average Sales Per Store
Now lets discuss how to solve the problem “What is the average sales amount per store”. For this, we use the same pattern as above
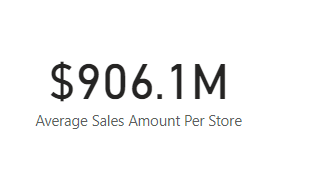
Average Sales Amount Per Store = AVERAGEX ( VALUES ( DimStore[StoreName] ), [Total Sales] )
This gives the following results
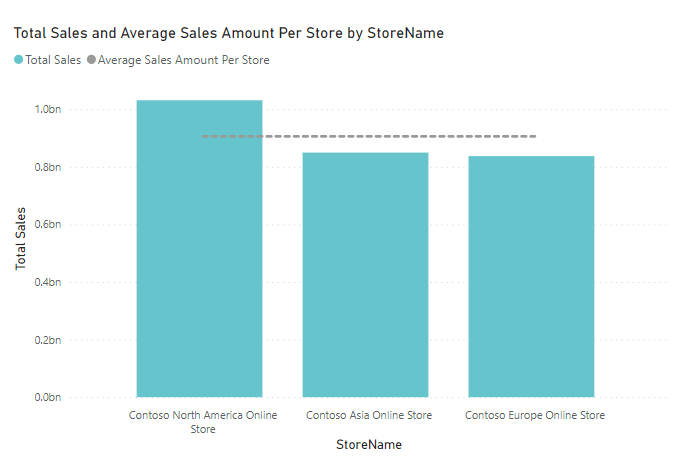
Most of the time, businesses are not interested in a single number for “Average sales amount by store” but they are interested to see it in a total sales by store bar chart as a line so that they can visualise which stores have sales above/below average. The pattern for this involves using CALCULATE and ALL functions and it looks like this. The ALL is needed to remove the filter context from the StoreName column in the bar chart.
Average Sales Amount Per Store =
CALCULATE (
AVERAGEX ( VALUES ( DimStore[StoreName] ), [Total Sales] ),
ALL ( DimStore[StoreName] )
)
The bar chart looks like this for the current model
Now what if we dont have the column ‘SalesAmount’ in the model ? We cannot use the above pattern to calculate Average Sales. We need to use a pattern which first creates a virtual table in which we calculate a new column by multiplying the columns SalesQuantity and UnitPrice and subtracting any DiscountAmount and then iterating over that table to get the average sales. The pattern looks like this
Average Sales Amount Per Store =
VAR t1 =
ADDCOLUMNS (
SUMMARIZE ( FactOnlineSales, DimStore[StoreName] ),
“TotalSales”,
CALCULATE (
SUMX (
FactOnlineSales,
FactOnlineSales[SalesQuantity] * FactOnlineSales[UnitPrice] – FactOnlineSales[DiscountAmount]
),
FactOnlineSales[SalesQuantity] > 0
)
)
RETURN
AVERAGEX ( t1, [TotalSales] )
This pattern is longer and not simple. Hence it is advisable to calculate the column ‘SalesAmount’ in the Fact table in the source so that we can easily retrieve it to calculate ‘Average Sales’ and use easier patterns.
SUMMARY
In this second part of the series on how to solve business problems using DAX we have covered business problems which involve averages and provided DAX formulas for each of them. Use the following patterns to answer the following questions.
Any problem involving averaging fact table columns in the same grain as in the model and if the questions are like the following
- What is the average sales amount by sales order line number ?
- What is the average temperature ?
- What is the average queue time ?
Average Sales Amount Per Sales Order Line Number = AVERAGE ( FactOnlineSales[SalesAmount] )
Any problem involving averaging fact table columns by dimension/fact table entities at a higher grain than the column to be averaged
- What is the average sales amount per store ?
- What is the average rainfall per year ?
- What is the average sales calls per region
Average Sales Amount Per Store = AVERAGEX ( VALUES ( DimStore[StoreName] ), [Total Sales] )
If you want to use this as a line in total sales amount bar chart, use this pattern
Average Sales Amount Per Store =
CALCULATE (
AVERAGEX ( VALUES ( DimStore[StoreName] ), [Total Sales] ),
ALL ( DimStore[StoreName] )
)
If you have to calculate ‘SalesAmount’ column in a virtual pattern because its not available in the model, use this pattern
Average Sales Amount Per Store =
VAR t1 =
ADDCOLUMNS (
SUMMARIZE ( FactOnlineSales, DimStore[StoreName] ),
“TotalSales”,
CALCULATE (
SUMX (
FactOnlineSales,
FactOnlineSales[SalesQuantity] * FactOnlineSales[UnitPrice] – FactOnlineSales[DiscountAmount]
),
FactOnlineSales[SalesQuantity] > 0
)
)
RETURN
AVERAGEX ( t1, [TotalSales] )